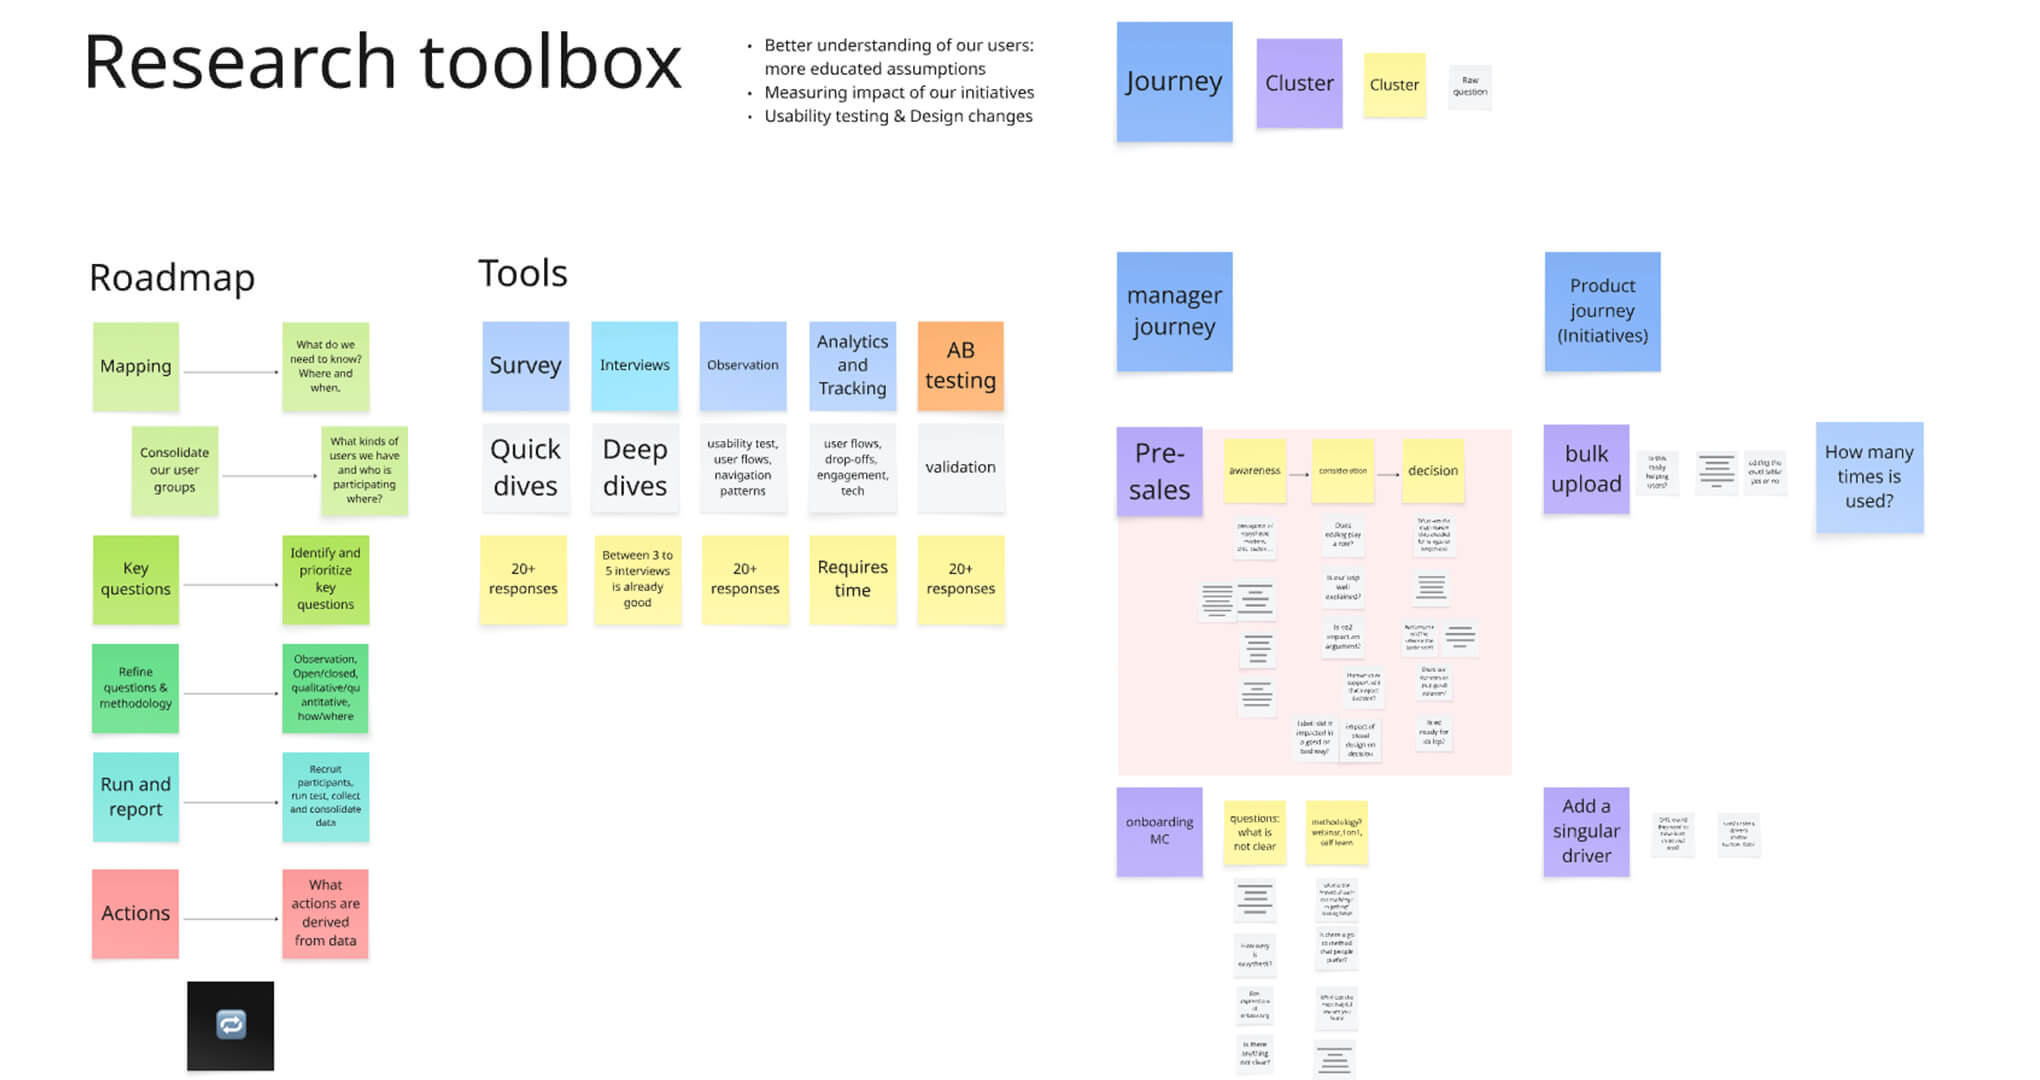
My goal was clear: implement a research toolbox accessible to everyone, rooted in data-backed insights, and built to support both product and business decisions.
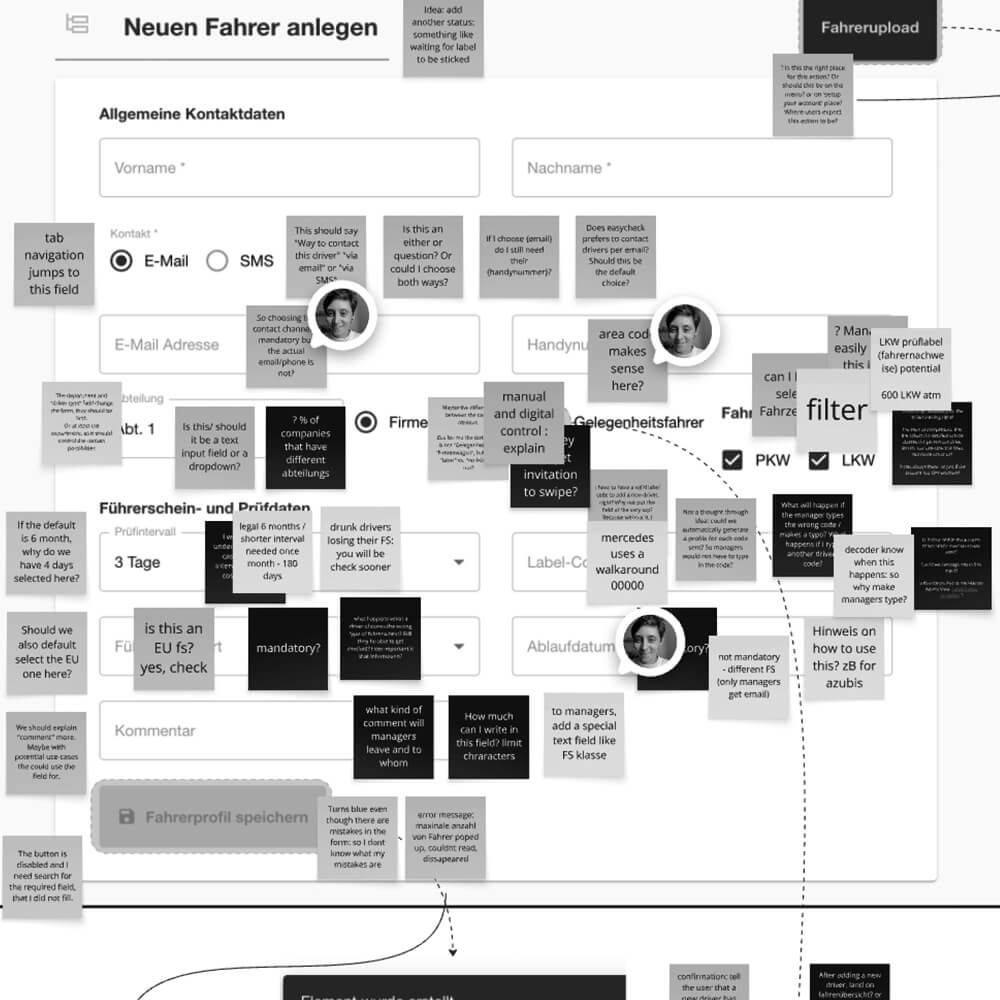
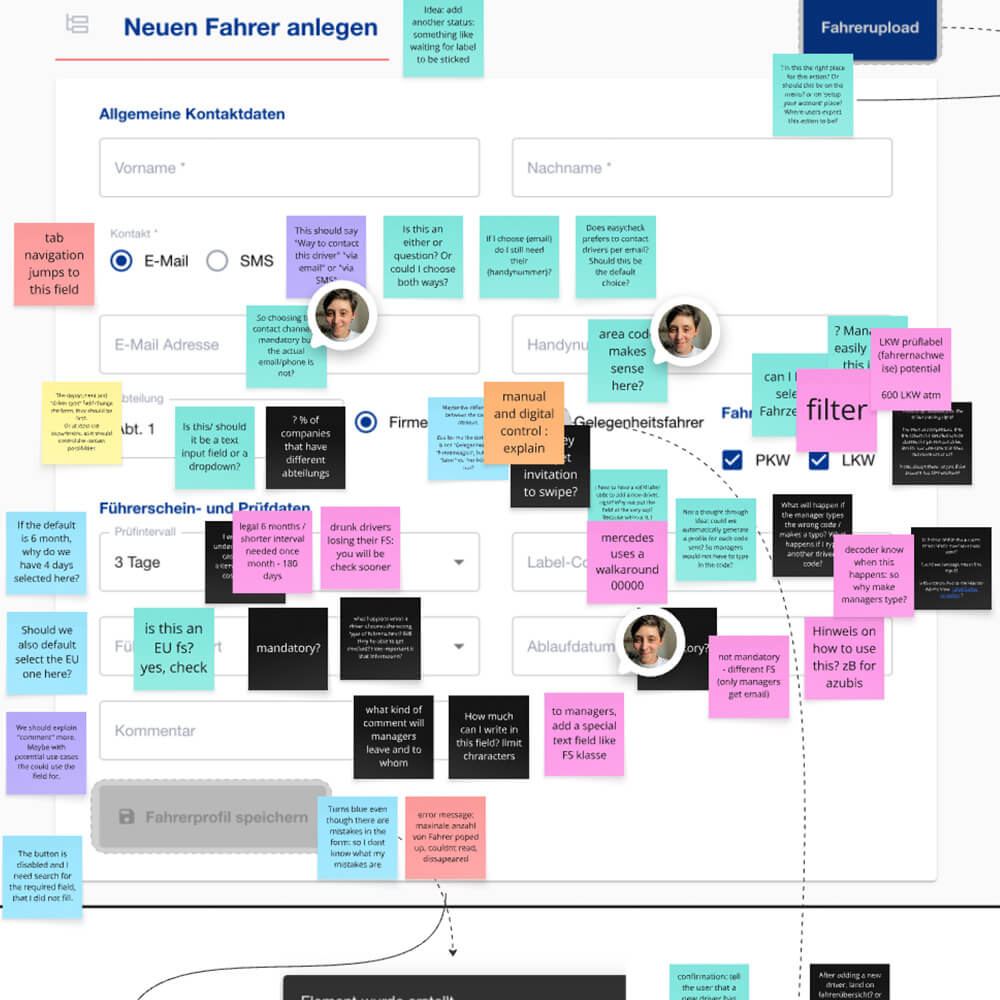
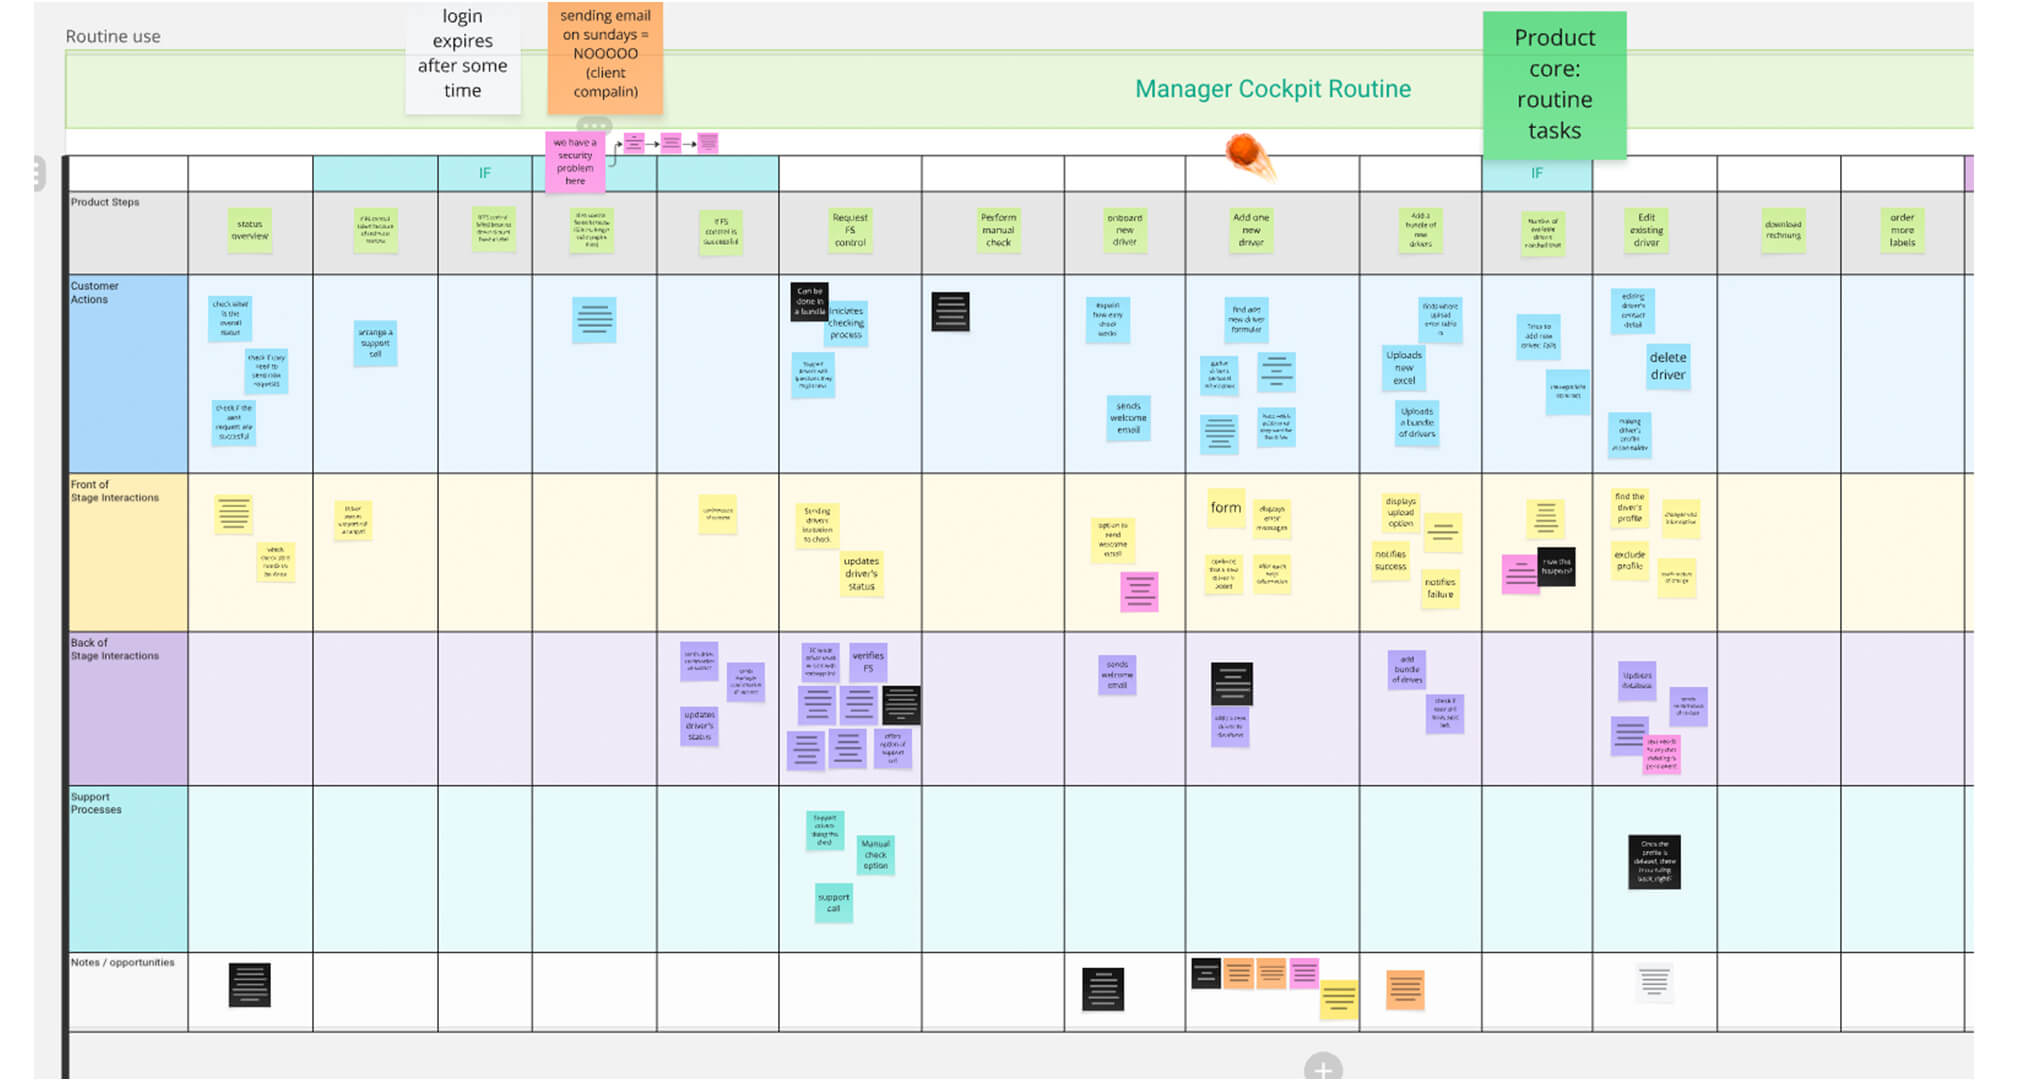
Before asking questions externally, I needed to understand the internal product ecosystem. I created a collaborative, asynchronous service blueprinting board that mapped the end-to-end easycheck journey — onboarding, setup, daily use — from both user and operational perspectives.
The goal was to uncover friction points, visualise complexity across touchpoints, and identify where design or process improvements were needed.
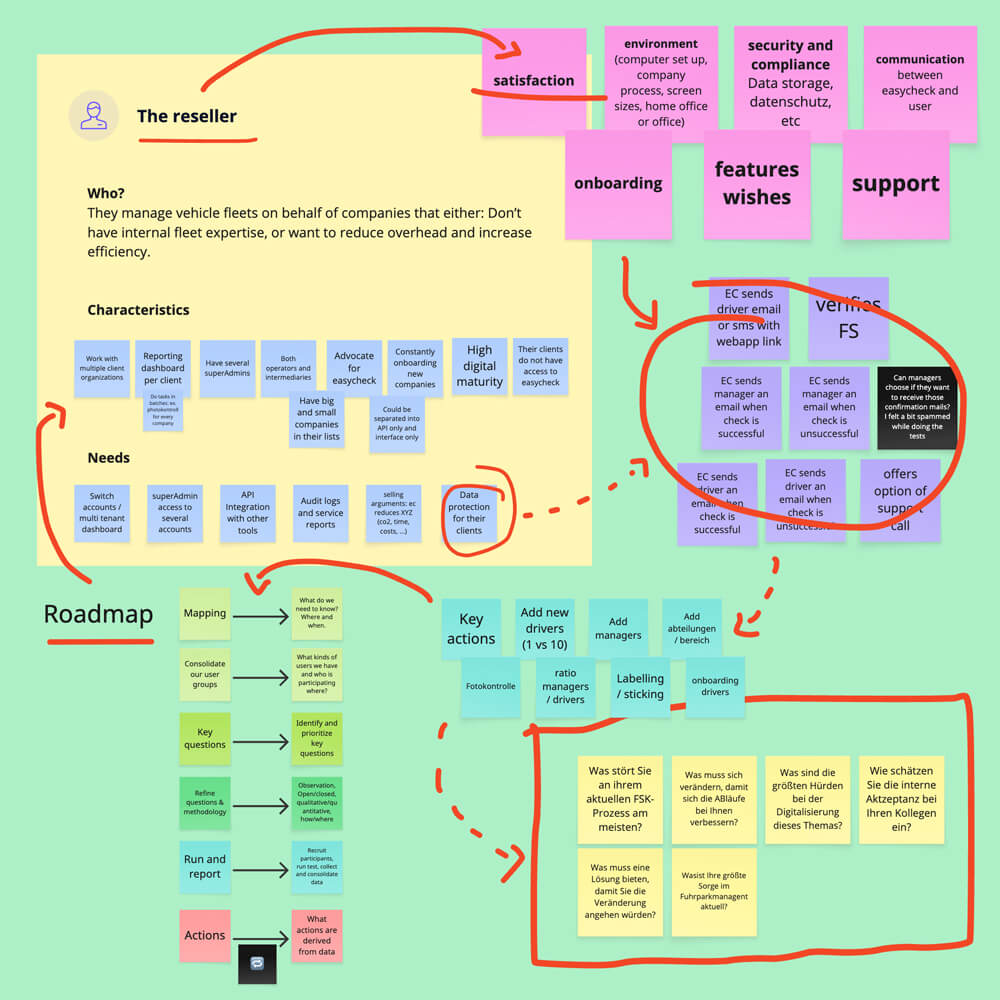
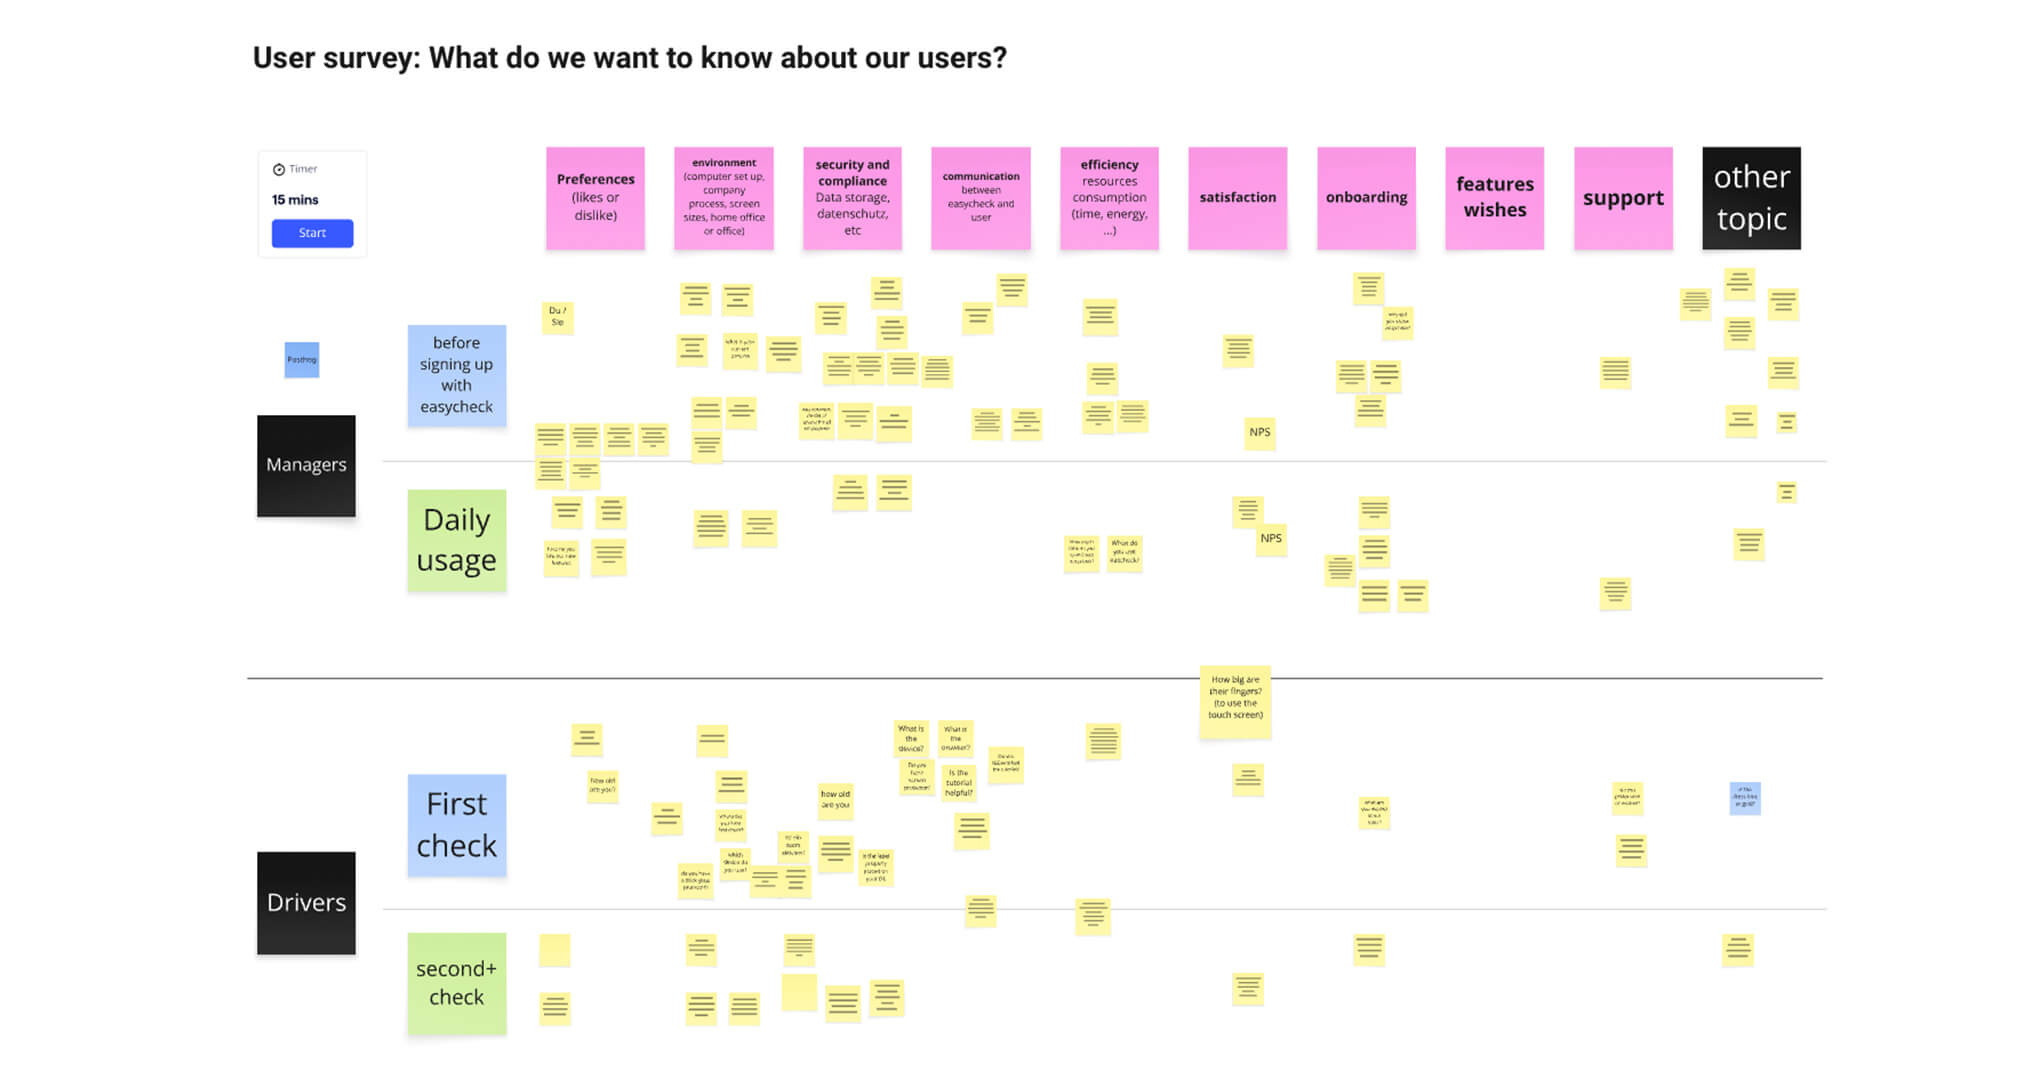
With the service map as a foundation, I facilitated a cross-functional workshop involving support, sales, engineering, and product leadership. Our goal was simple: Identify what we don’t know about our users.
Since we didn’t yet have formal personas, I split the board into two user groups: Managers and Drivers, and suggested thematic prompts like onboarding, compliance, and support. That framing helped the team articulate real questions — like “Do users prefer chat or phone support?” — and surface assumptions we’d been working from without validation.
From there, I collected all input, followed up with one-on-one interviews across departments, and compiled the first centralised knowledge map of open questions and product blind spots.
To move from assumptions to strategy, I started mapping out our users based on company profile and operational behaviour. Drawing from past discovery interviews and new conversations with sales and support teams, I created an initial segmentation:
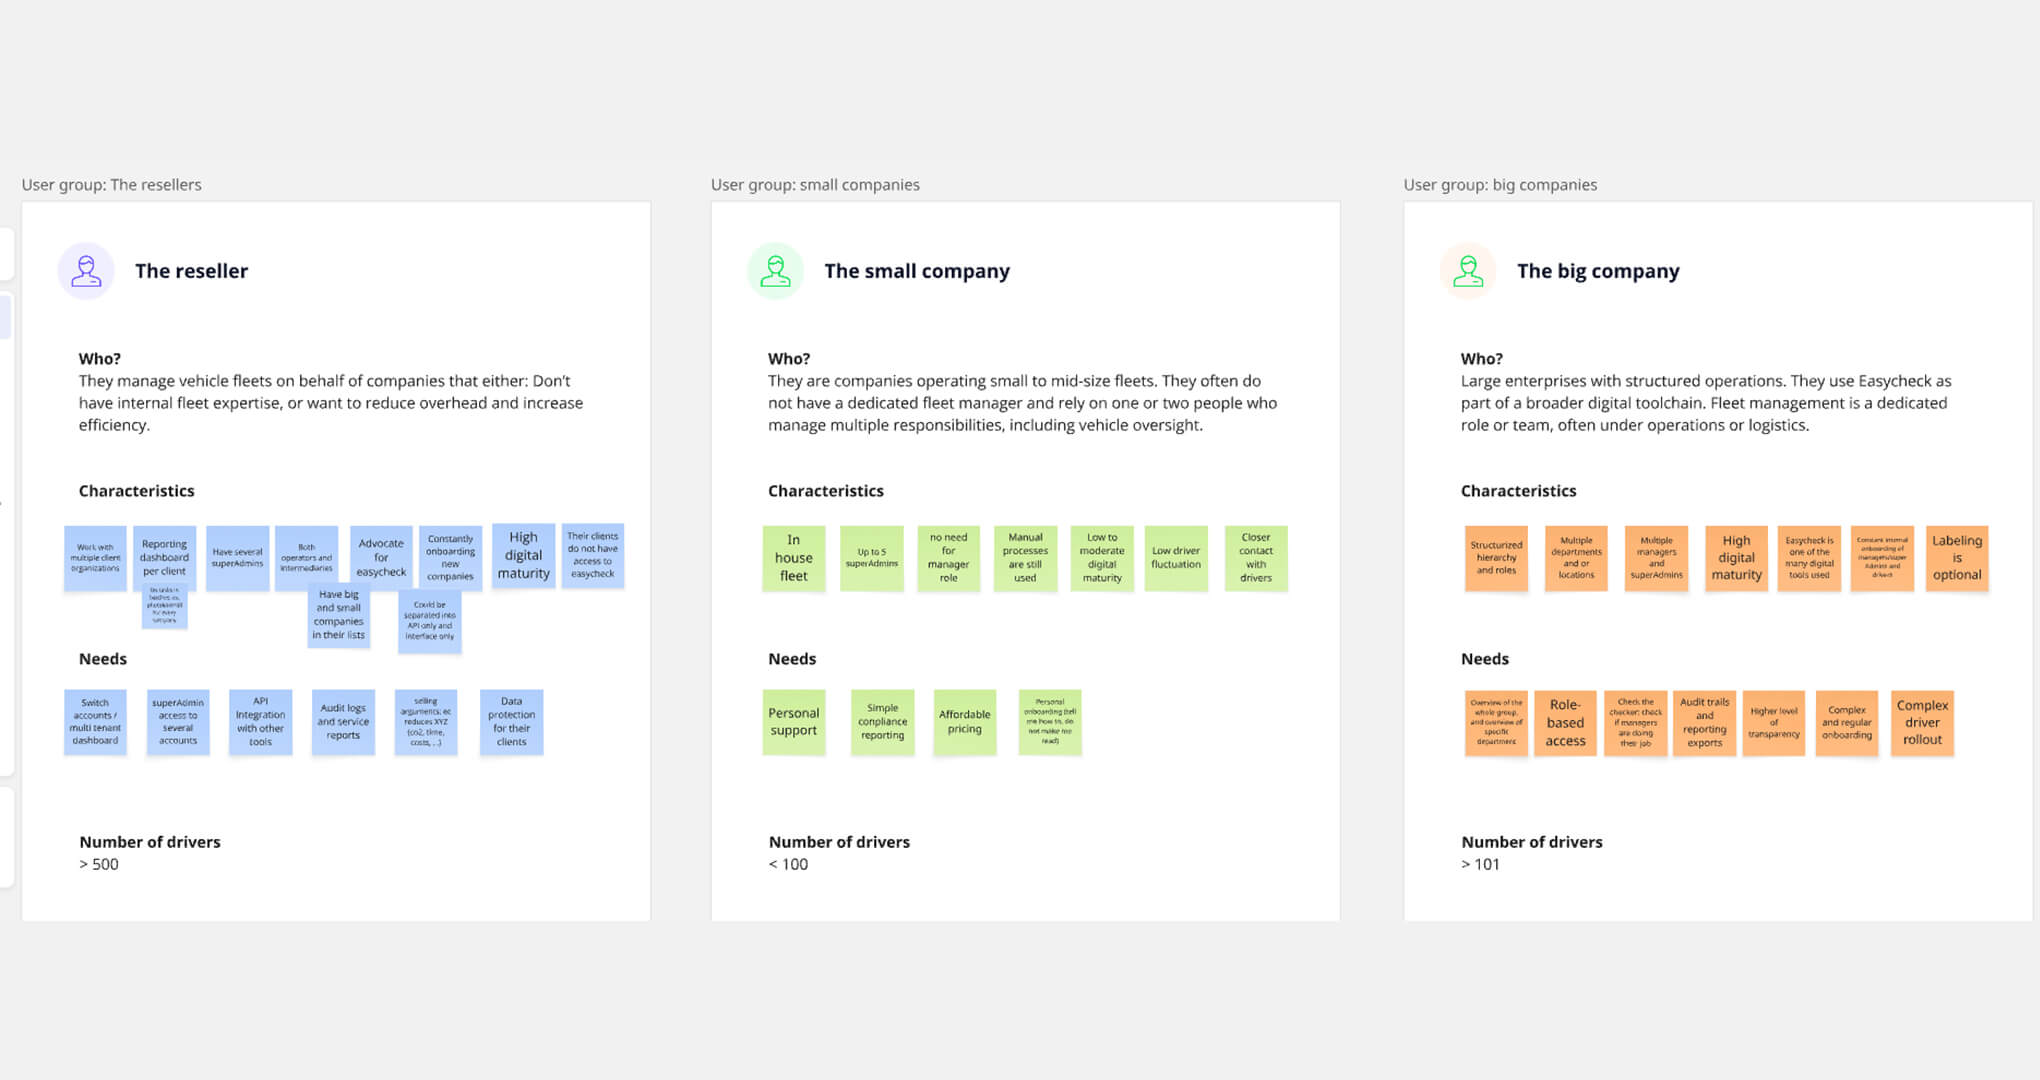
We also began tracking metadata like industries served, number of managers, team structures, and label kit usage, by connecting backend user IDs to analytics tools (Metabase and PostHog). This gave us the context to build meaningful group profiles that aligned user needs with company realities.
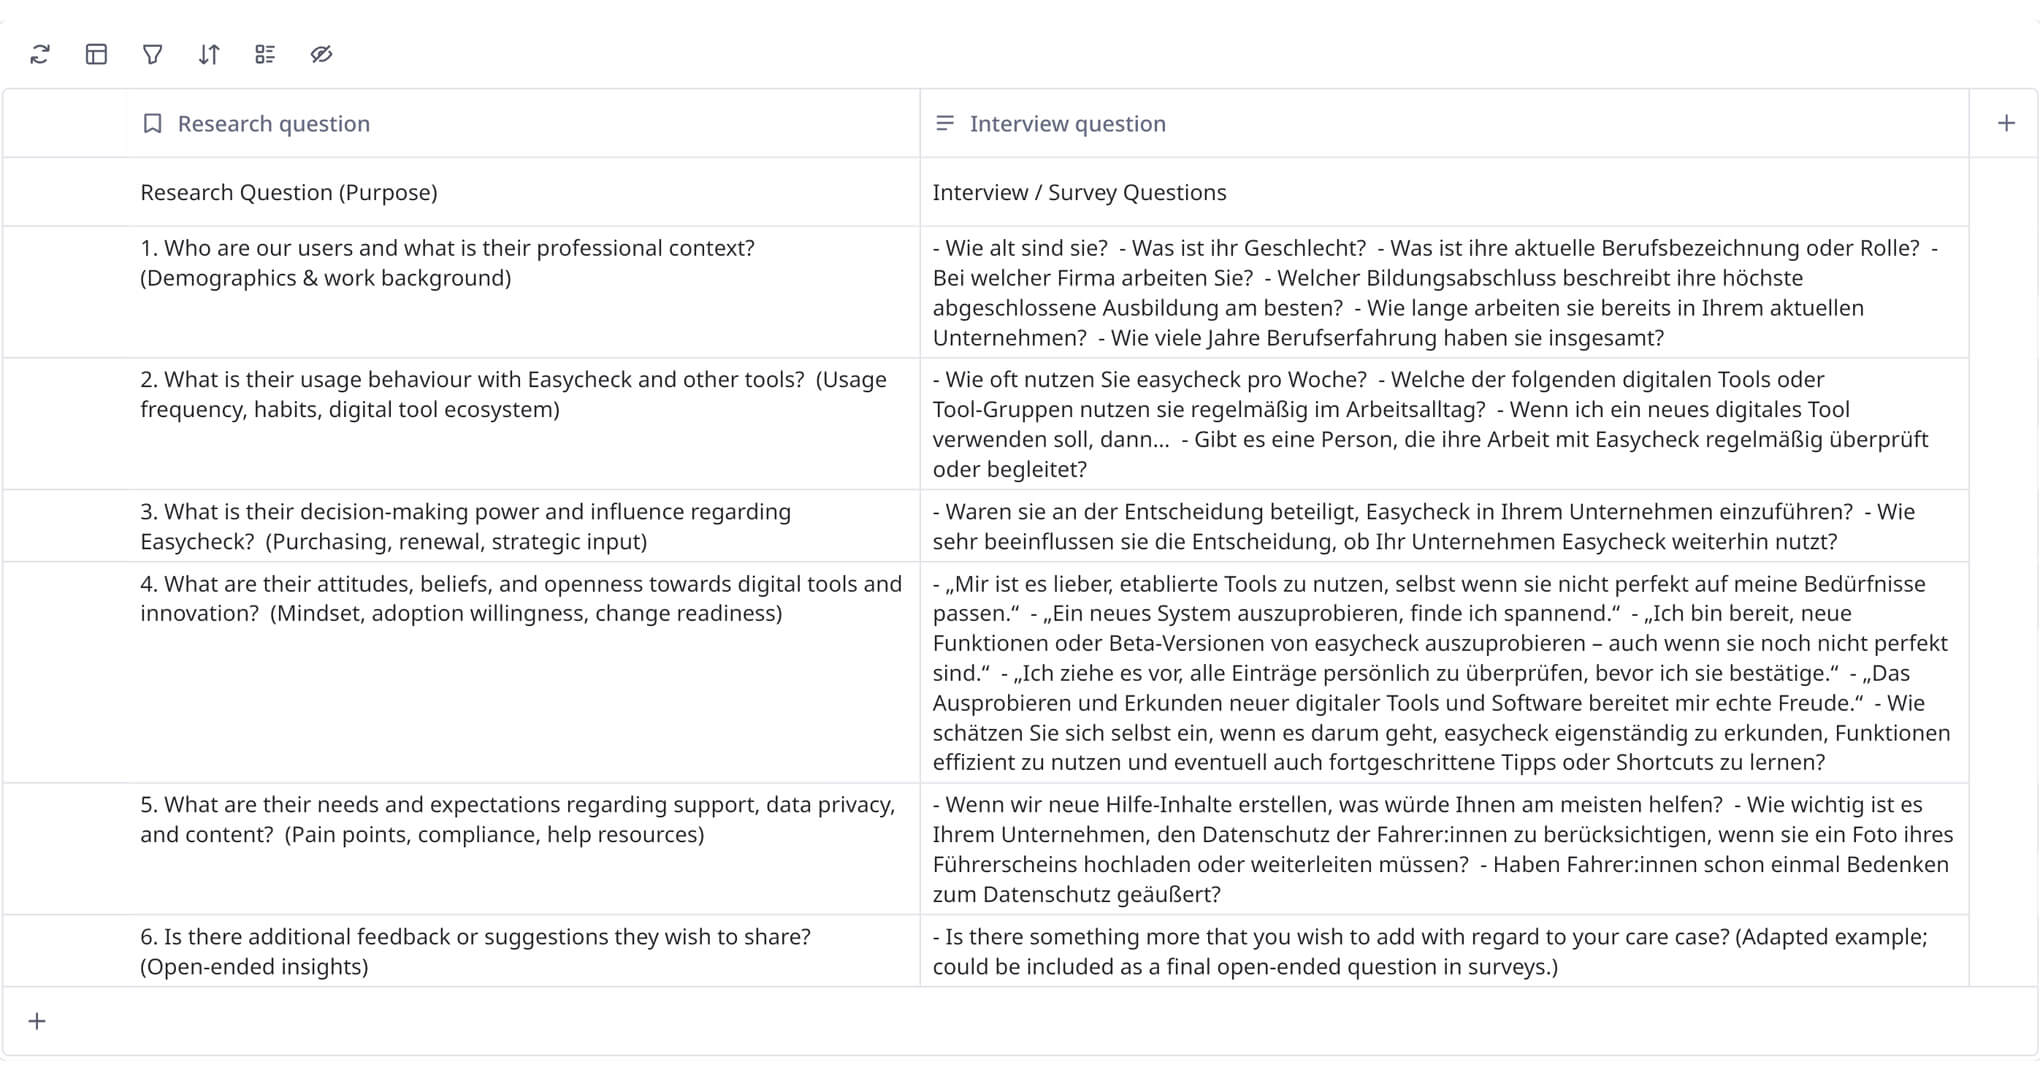
Once we had working hypotheses and solid analytics in place, I moved into writing our first user survey. The goal was to create statistically valid user personas, grounded in both behavioural data and contextual insights. To achieve this, I segmented our user base by user group, role (Manager or Driver), and driver check type (we offered two variants). For each segment, I calculated the minimum number of responses needed to ensure statistical validity — taking into account population size, confidence level, and margin of error — so that our findings would be both reliable and representative.
Each user question was built around a core set of research questions, structured under key thematic areas:
Once data was collected, I ran a research playback session with stakeholders across the business. We highlighted key insights and opened the floor for questions and interpretation. Everything was documented in Confluence, creating a shared research library that continues to: